Price level
How far does a dollar stretch there compared with the US?
What a dollar’s worth of goods costs there, with the United States at 1.00 — the World Bank PPP conversion factor divided by the official exchange rate, both for the same year. 0.31 means roughly a third of US prices.
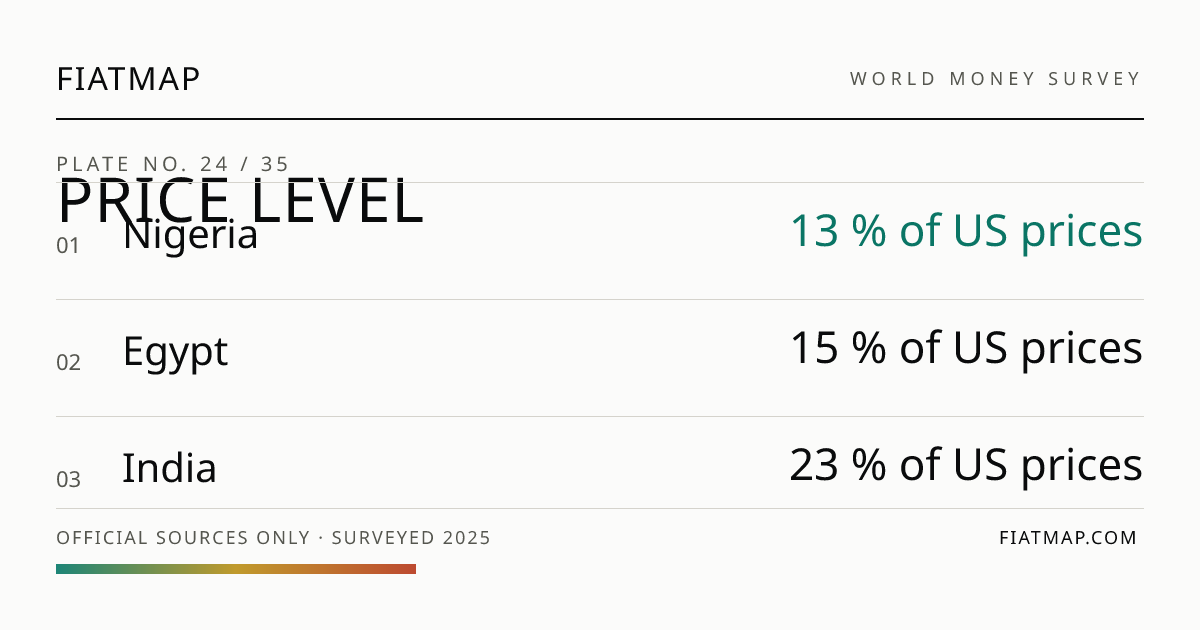
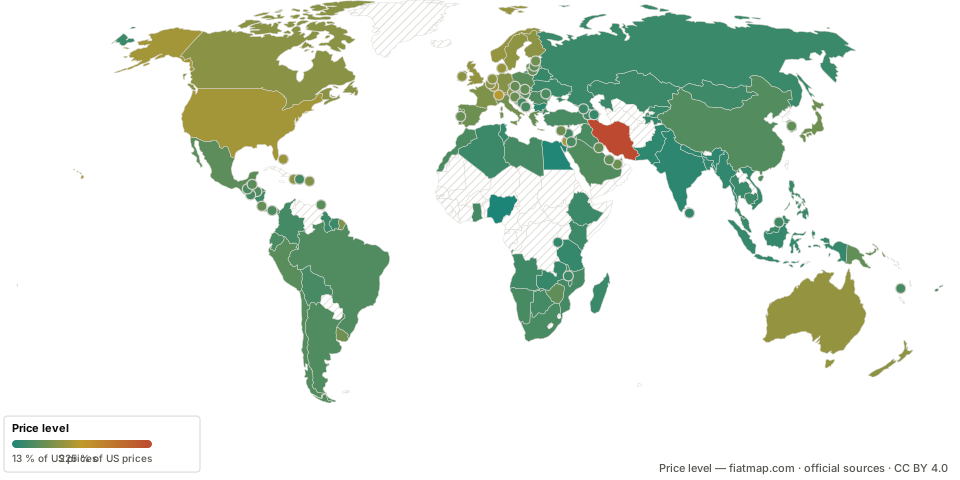
Nigeria leads with 13 % of US prices; Iran sits last at 225 % of US prices. Best-for-you first — lower is better here.
Coverage: 125 of ~113 countries this field can reach — World Bank PPP factor ÷ official exchange rate; 113 of 128 carry both legs in a shared year
Free to republish — just credit us
Fiatmap, “Price level by country”, fiatmap.com/rankings/purchasing-power-parity. Licensed CC BY 4.0. Underlying data: official statistics (BIS, ECB, FRED, Eurostat, OECD, World Bank, SSB), each value dated at source.
Embed this on your own site
Top-10 table (live)
<iframe src="https://fiatmap.com/embed/ranking/purchasing-power-parity" title="Price level by country — Fiatmap" width="360" height="440" style="border:0" loading="lazy"></iframe>
World map
<iframe src="https://fiatmap.com/embed/map/purchasing-power-parity" title="Price level by country — Fiatmap" width="720" height="430" style="border:0" loading="lazy"></iframe>
On the map
The full ranking
| 1 | Nigeria | 13 % of US prices | 2025 | Checked 22 Sept 2026 |
| 2 | Egypt | 15 % of US prices | 2025 | Checked 22 Sept 2026 |
| 3 | India | 23 % of US prices | 2025 | Checked 22 Sept 2026 |
| 4 | Bulgaria | 23 % of US prices | 2025 | Checked 22 Sept 2026 |
| 5 | Pakistan | 24 % of US prices | 2025 | Checked 22 Sept 2026 |
| 6 | Nepal | 24 % of US prices | 2025 | Checked 22 Sept 2026 |
| 7 | Bangladesh | 25 % of US prices | 2025 | Checked 22 Sept 2026 |
| 8 | Myanmar | 26 % of US prices | 2020 | Checked 22 Sept 2026 |
| 9 | Sri Lanka | 26 % of US prices | 2023 | Checked 22 Sept 2026 |
| 10 | Rwanda | 27 % of US prices | 2025 | Checked 22 Sept 2026 |
| 11 | Tajikistan | 28 % of US prices | 2025 | Checked 22 Sept 2026 |
| 12 | Tanzania | 28 % of US prices | 2024 | Checked 22 Sept 2026 |
| 13 | Azerbaijan | 28 % of US prices | 2025 | Checked 22 Sept 2026 |
| 14 | Indonesia | 29 % of US prices | 2025 | Checked 22 Sept 2026 |
| 15 | Vietnam | 29 % of US prices | 2024 | Checked 22 Sept 2026 |
| 16 | Tunisia | 29 % of US prices | 2024 | Checked 22 Sept 2026 |
| 17 | Belarus | 30 % of US prices | 2025 | Checked 22 Sept 2026 |
| 18 | Zambia | 30 % of US prices | 2025 | Checked 22 Sept 2026 |
| 19 | Kyrgyzstan | 31 % of US prices | 2024 | Checked 22 Sept 2026 |
| 20 | Madagascar | 31 % of US prices | 2025 | Checked 22 Sept 2026 |
| 21 | Thailand | 31 % of US prices | 2025 | Checked 22 Sept 2026 |
| 22 | Ukraine | 31 % of US prices | 2025 | Checked 22 Sept 2026 |
| 23 | Suriname | 31 % of US prices | 2025 | Checked 22 Sept 2026 |
| 24 | Russia | 31 % of US prices | 2024 | Checked 22 Sept 2026 |
| 25 | Malaysia | 32 % of US prices | 2025 | Checked 22 Sept 2026 |
| 26 | Algeria | 33 % of US prices | 2025 | Checked 22 Sept 2026 |
| 27 | Ethiopia | 33 % of US prices | 2024 | Checked 22 Sept 2026 |
| 28 | Georgia | 33 % of US prices | 2025 | Checked 22 Sept 2026 |
| 29 | Guyana | 33 % of US prices | 2025 | Checked 22 Sept 2026 |
| 30 | Kazakhstan | 33 % of US prices | 2025 | Checked 22 Sept 2026 |
| 31 | Philippines | 33 % of US prices | 2025 | Checked 22 Sept 2026 |
| 32 | Cambodia | 34 % of US prices | 2025 | Checked 22 Sept 2026 |
| 33 | Kenya | 34 % of US prices | 2025 | Checked 22 Sept 2026 |
| 34 | Mongolia | 34 % of US prices | 2025 | Checked 22 Sept 2026 |
| 35 | Nicaragua | 34 % of US prices | 2025 | Checked 22 Sept 2026 |
| 36 | Malawi | 35 % of US prices | 2023 | Checked 22 Sept 2026 |
| 37 | Brunei | 35 % of US prices | 2025 | Checked 22 Sept 2026 |
| 38 | Angola | 35 % of US prices | 2025 | Checked 22 Sept 2026 |
| 39 | Lebanon | 38 % of US prices | 2024 | Checked 22 Sept 2026 |
| 40 | Botswana | 38 % of US prices | 2025 | Checked 22 Sept 2026 |
| 41 | Colombia | 38 % of US prices | 2025 | Checked 22 Sept 2026 |
| 42 | Ghana | 38 % of US prices | 2025 | Checked 22 Sept 2026 |
| 43 | Armenia | 38 % of US prices | 2025 | Checked 22 Sept 2026 |
| 44 | Dominican Republic | 39 % of US prices | 2025 | Checked 22 Sept 2026 |
| 45 | Mozambique | 39 % of US prices | 2024 | Checked 22 Sept 2026 |
| 46 | Mauritius | 39 % of US prices | 2025 | Checked 22 Sept 2026 |
| 47 | Libya | 39 % of US prices | 2025 | Checked 22 Sept 2026 |
| 48 | Bolivia | 40 % of US prices | 2025 | Checked 22 Sept 2026 |
| 49 | Bosnia and Herzegovina | 40 % of US prices | 2025 | Checked 22 Sept 2026 |
| 50 | Fiji | 41 % of US prices | 2025 | Checked 22 Sept 2026 |
| 51 | Namibia | 41 % of US prices | 2025 | Checked 22 Sept 2026 |
| 52 | El Salvador | 41 % of US prices | 2025 | Checked 22 Sept 2026 |
| 53 | Kosovo | 41 % of US prices | 2025 | Checked 22 Sept 2026 |
| 54 | Turkey | 41 % of US prices | 2025 | Checked 22 Sept 2026 |
| 55 | South Africa | 42 % of US prices | 2025 | Checked 22 Sept 2026 |
| 56 | Montenegro | 42 % of US prices | 2025 | Checked 22 Sept 2026 |
| 57 | Iraq | 42 % of US prices | 2024 | Checked 22 Sept 2026 |
| 58 | Morocco | 42 % of US prices | 2025 | Checked 22 Sept 2026 |
| 59 | Jordan | 42 % of US prices | 2025 | Checked 22 Sept 2026 |
| 60 | Ecuador | 43 % of US prices | 2025 | Checked 22 Sept 2026 |
| 61 | Bahrain | 43 % of US prices | 2025 | Checked 22 Sept 2026 |
| 62 | Moldova | 43 % of US prices | 2025 | Checked 22 Sept 2026 |
| 63 | Guatemala | 43 % of US prices | 2025 | Checked 22 Sept 2026 |
| 64 | Romania | 44 % of US prices | 2025 | Checked 22 Sept 2026 |
| 65 | Panama | 45 % of US prices | 2025 | Checked 22 Sept 2026 |
| 66 | Argentina | 46 % of US prices | 2025 | Checked 22 Sept 2026 |
| 67 | Brazil | 46 % of US prices | 2025 | Checked 22 Sept 2026 |
| 68 | Honduras | 46 % of US prices | 2025 | Checked 22 Sept 2026 |
| 69 | Saudi Arabia | 47 % of US prices | 2025 | Checked 22 Sept 2026 |
| 70 | China | 47 % of US prices | 2025 | Checked 22 Sept 2026 |
| 71 | Chile | 48 % of US prices | 2025 | Checked 22 Sept 2026 |
| 72 | Trinidad and Tobago | 51 % of US prices | 2025 | Checked 22 Sept 2026 |
| 73 | Peru | 52 % of US prices | 2025 | Checked 22 Sept 2026 |
| 74 | Hungary | 52 % of US prices | 2025 | Checked 22 Sept 2026 |
| 75 | Poland | 52 % of US prices | 2025 | Checked 22 Sept 2026 |
| 76 | Belize | 53 % of US prices | 2025 | Checked 22 Sept 2026 |
| 77 | Croatia | 53 % of US prices | 2025 | Checked 22 Sept 2026 |
| 78 | Mexico | 54 % of US prices | 2025 | Checked 22 Sept 2026 |
| 79 | Zimbabwe | 56 % of US prices | 2025 | Checked 22 Sept 2026 |
| 80 | Qatar | 56 % of US prices | 2025 | Checked 22 Sept 2026 |
| 81 | Latvia | 57 % of US prices | 2025 | Checked 22 Sept 2026 |
| 82 | Kuwait | 57 % of US prices | 2025 | Checked 22 Sept 2026 |
| 83 | South Korea | 57 % of US prices | 2025 | Checked 22 Sept 2026 |
| 84 | Papua New Guinea | 58 % of US prices | 2025 | Checked 22 Sept 2026 |
| 85 | Slovakia | 58 % of US prices | 2025 | Checked 22 Sept 2026 |
| 86 | Lithuania | 58 % of US prices | 2025 | Checked 22 Sept 2026 |
| 87 | Costa Rica | 59 % of US prices | 2025 | Checked 22 Sept 2026 |
| 88 | Czech Republic | 59 % of US prices | 2025 | Checked 22 Sept 2026 |
| 89 | Greece | 60 % of US prices | 2025 | Checked 22 Sept 2026 |
| 90 | Portugal | 60 % of US prices | 2025 | Checked 22 Sept 2026 |
| 91 | Singapore | 61 % of US prices | 2025 | Checked 22 Sept 2026 |
| 92 | Slovenia | 63 % of US prices | 2025 | Checked 22 Sept 2026 |
| 93 | United Arab Emirates | 63 % of US prices | 2024 | Checked 22 Sept 2026 |
| 94 | Spain | 65 % of US prices | 2025 | Checked 22 Sept 2026 |
| 95 | Cyprus | 65 % of US prices | 2025 | Checked 22 Sept 2026 |
| 96 | Japan | 65 % of US prices | 2025 | Checked 22 Sept 2026 |
| 97 | Uruguay | 66 % of US prices | 2025 | Checked 22 Sept 2026 |
| 98 | Estonia | 66 % of US prices | 2025 | Checked 22 Sept 2026 |
| 99 | Malta | 66 % of US prices | 2025 | Checked 22 Sept 2026 |
| 100 | Andorra | 68 % of US prices | 2025 | Checked 22 Sept 2026 |
| 101 | Italy | 69 % of US prices | 2025 | Checked 22 Sept 2026 |
| 102 | Hong Kong | 71 % of US prices | 2025 | Checked 22 Sept 2026 |
| 103 | France | 77 % of US prices | 2025 | Checked 22 Sept 2026 |
| 104 | Puerto Rico | 78 % of US prices | 2025 | Checked 22 Sept 2026 |
| 105 | Germany | 80 % of US prices | 2025 | Checked 22 Sept 2026 |
| 106 | Belgium | 81 % of US prices | 2025 | Checked 22 Sept 2026 |
| 107 | Austria | 82 % of US prices | 2025 | Checked 22 Sept 2026 |
| 108 | Canada | 83 % of US prices | 2025 | Checked 22 Sept 2026 |
| 109 | Netherlands | 84 % of US prices | 2025 | Checked 22 Sept 2026 |
| 110 | Ireland | 85 % of US prices | 2025 | Checked 22 Sept 2026 |
| 111 | Finland | 85 % of US prices | 2025 | Checked 22 Sept 2026 |
| 112 | New Zealand | 86 % of US prices | 2025 | Checked 22 Sept 2026 |
| 113 | Haiti | 86 % of US prices | 2025 | Checked 22 Sept 2026 |
| 114 | Sweden | 87 % of US prices | 2025 | Checked 22 Sept 2026 |
| 115 | United Kingdom | 89 % of US prices | 2025 | Checked 22 Sept 2026 |
| 116 | Australia | 90 % of US prices | 2025 | Checked 22 Sept 2026 |
| 117 | Norway | 91 % of US prices | 2025 | Checked 22 Sept 2026 |
| 118 | Denmark | 93 % of US prices | 2025 | Checked 22 Sept 2026 |
| 119 | Luxembourg | 94 % of US prices | 2025 | Checked 22 Sept 2026 |
| 120 | Bahamas | 96 % of US prices | 2024 | Checked 22 Sept 2026 |
| 121 | United States | 100 % of US prices | 2025 | Checked 22 Sept 2026 |
| 122 | Israel | 101 % of US prices | 2025 | Checked 22 Sept 2026 |
| 123 | Barbados | 110 % of US prices | 2025 | Checked 22 Sept 2026 |
| 124 | Switzerland | 112 % of US prices | 2025 | Checked 22 Sept 2026 |
| 125 | Iran | 225 % of US prices | 2023 | Checked 22 Sept 2026 |
Regional averages
Europe (38)
64 % of US prices
Americas (26)
56 % of US prices
Asia (36)
46 % of US prices
Africa (21)
34 % of US prices
Oceania (4)
69 % of US prices
Unweighted mean of the published values in each region — our aggregation, not an official statistic.
How to read this figure
Our own calculation from two World Bank figures for the SAME year: the PPP conversion factor divided by the official exchange rate. It answers "is this country expensive?" in the only way that survives a currency swing — 1.00 is the United States, 0.31 means a dollar's worth of goods costs about 31 cents there, and 1.12 means it costs 12 % more. The raw PPP factor is deliberately not shown on its own: it is quoted in local currency per international dollar, so Vietnam reads 147938 and the US reads 1.00, and neither end of that is "better". Note this is a whole-economy average built from GDP, so it covers everything a country produces, not a traveller's basket — rent and restaurant prices can sit well above or below it.
Countries with the lowest price level · Countries with the highest price level
How to read this list
What a dollar’s worth of goods costs there, with the United States at 1.00 — the World Bank PPP conversion factor divided by the official exchange rate, both for the same year. 0.31 means roughly a third of US prices. 125 countries publish it; the rest are absent from the list rather than shown as zero. The figures were observed between 2020 and 2025 — a spread of 60 months — so this compares each country’s latest published number, not one moment in time. Every row carries its own date in the CSV and JSON; use it. Nothing here is estimated or carried forward to fill a gap. This metric is one column of the full dataset.